Debugging is a programming term that implies examining the program to find errors and fix them. Errors are not necessarily bad. Most of the time, debugging helps users recognize errors in their code.
Programmers must know how to debug their code and fix those errors. Often programming errors are tough to diagnose, and there will be no error message that will make users aware of the error.
There are different methods in JavaScript that help users to recognize and debug the program. This article will discuss all these ways of debugging in JavaScript (debugging JavaScript in a browser).
What is debugging in JavaScript?
The term Debugging means searching for errors and fixing them. In programming, debugging is easy as well as hard if users do use the right debugging process in JavaScript.
But fortunately, all modern browsers include a built-in JavaScript debugger which is easy to use and debugs errors immediately. There are different ways to debug errors, and these are as follows
Method 1: Using the "debugger" keyword
It is one of the most flexible methods of all. Here, users only need to use the debugger keyword as the breakpoint in the JavaScript program. The "debugger" keyword stops the implementation of the JS program and calls the debugging function if possible.
The keyword has similar functionality as putting a breakpoint to debug a program. But the point to remember is that if no debugging is available in the JavaScript engine, the debugger statement has no impact, and the browser will run the program as usual.
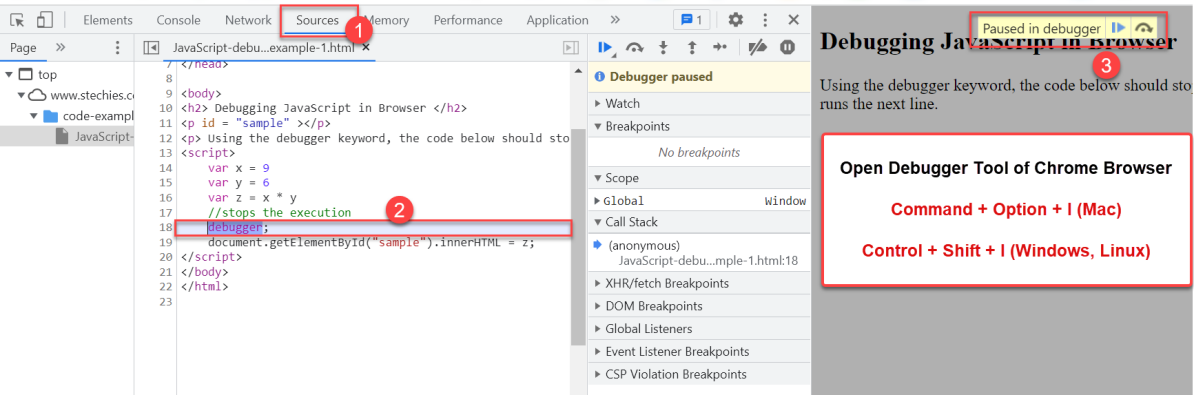
And if users turn on the debugger, the code will stop running before it runs the third or subsequent lines.
Open Debugger tool of chrome browser:
- By pressing Command+Option+I (Mac)
- By pressing Control+Shift+I (Windows, Linux)
Code Snippet:
<html>
<head>
<title>Debugging JavaScript in Browser</title>
</head>
<body>
<h2> Debugging JavaScript in Browser </h2>
<p id = "sample" ></p>
<p> Using the debugger keyword, the code below should stop running before it runs the next line. </p>
<script>
	var x = 9
	var y = 6
	var z = x * y
	//stops the execution
	debugger;
	document.getElementById("sample").innerHTML = z;
</script>
</body>
</html>
Output
Method 2: Using the breakpoints in the JS code
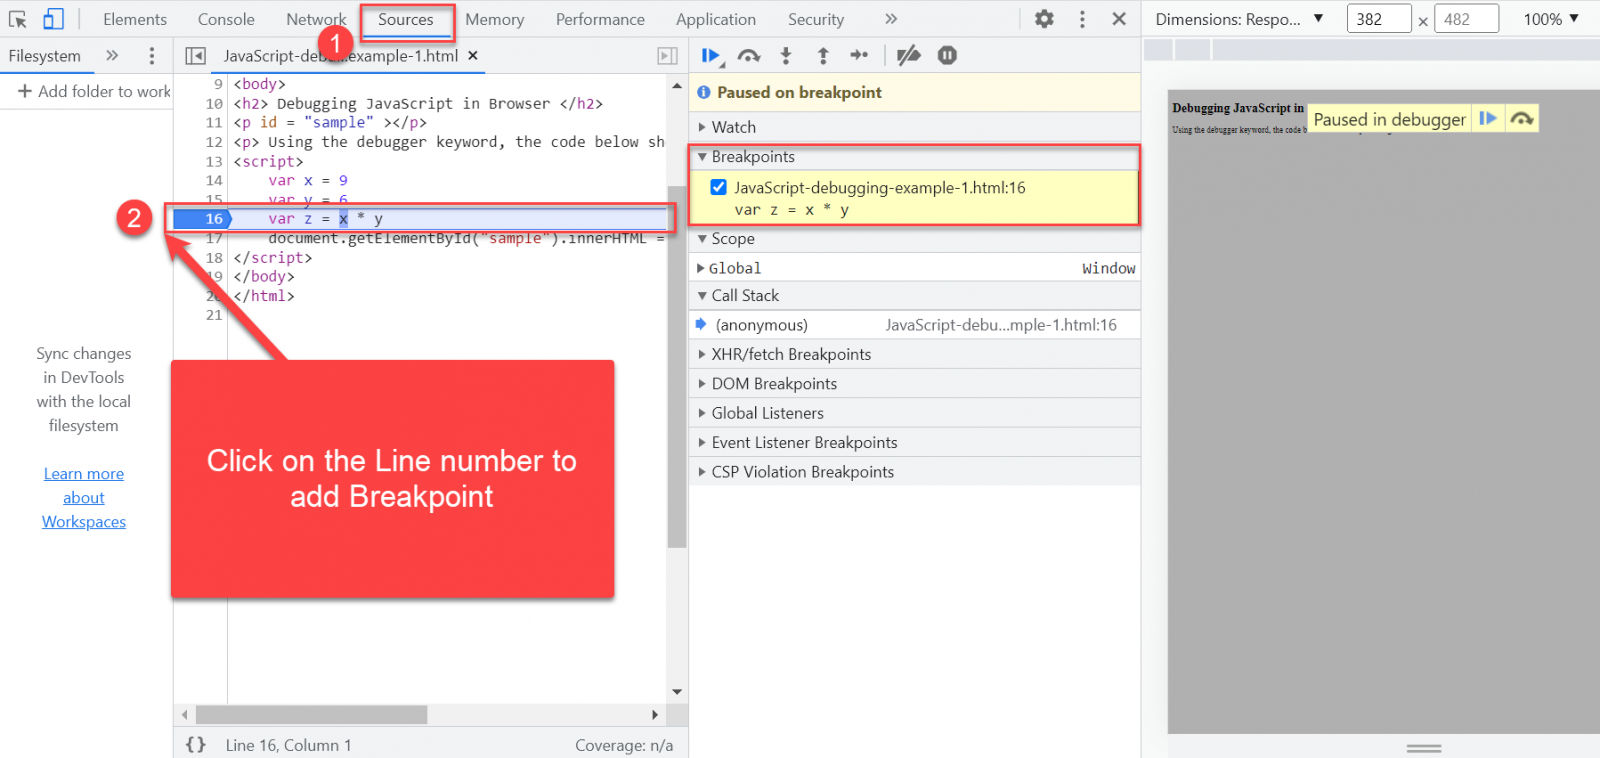
Setting breakpoints is one of the most crucial methods of all and is very easy for beginners and other programmers to carry on. When users mark the lines of code at different points of the program, they create breakpoints.
When the JS program reaches those marks that the users set as the breakpoint during execution, the JS engine pause the program. It allows the programmer to check if their program contains any error and sort it out.
Users can also mark the breakpoints in their JavaScript program from the console. Placing breakpoints in a JavaScript program is the same as putting a debugger in the JS code. Users can use Chrome browser or any other good IDEs that provide a way for them to debug their code.
How to add breakpoints from the console
Step 1: Open the Debugger tool of the chrome browser
Step 2: Click on the line number where you want to add breakpoint
Method 3: Using the backtracking method to debug a JavaScript program
Backtracking applies various solutions until a user finds the right solution to debug the errors. Among all the other methods in JavaScript, it is the most effective method for debugging.
In backtracking, users can apply possible solutions to crack the problem and find errors in the JavaScript code. If it does not work, users can exit and move on to another move.
Users can continue the debugging process until they successfully debug all the errors and obtain the resultant output.
Method 4: Using the console.log() method
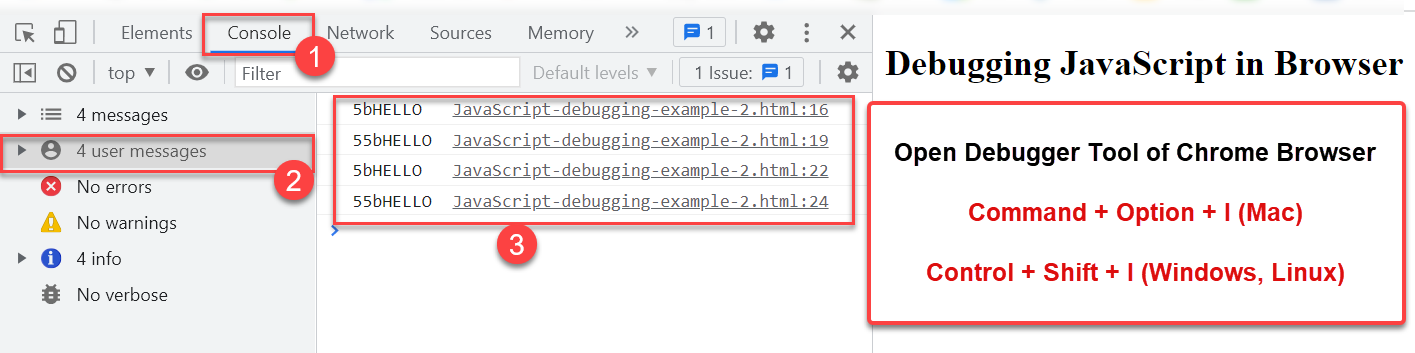
Users can also use the traditional console.log() method to debug the code. The console.log() is a JavaScript method that displays the message to the console.
They can pass any value they want to debug into the console.log() method and ascertain whether the data given is correct or not. Users can pass an object in console.log() or simply a message string as input.
Open the Debugger tool of chrome browser:
- By pressing Command+Option+I (Mac)
- By pressing Control+Shift+I (Windows, Linux)
Code Snippet:
<html>
<head>
<title>Debugging JavaScript in Browser</title>
</head>

<body>
<h2>Debugging JavaScript in Browser</h2>
<script>
	let a = 5;
	let b = 'HELLO';
	let c = a + 'b' + b;
	// if users need to display the value of c then they can set c into the method
	console.log(c);
	// if it runs the first operation then it will move to the if statement
	if(c) {
		console.log(a + c)
	}
	//if not then it will not print the if statement
	console.log(c)
	if(c) {
		console.log(a + c)
	}
</script>
</body>
</html>
Output:
Note: Other JavaScript engines can also have this built-in method to display and debug errors, as the console.log() method is not specific to any browser.
Conclusion:
In summary, the article brings up different methods to debug errors in the JavaScript program. We have mentioned four different ways, like the breakpoints, console.log() method, debugger keyword, and backtracking for debugging in JavaScript in the browser.