How to find QM BADIs?
- First, run t-code SE80.
- Then on the left panel select button 'Repository Information System'.
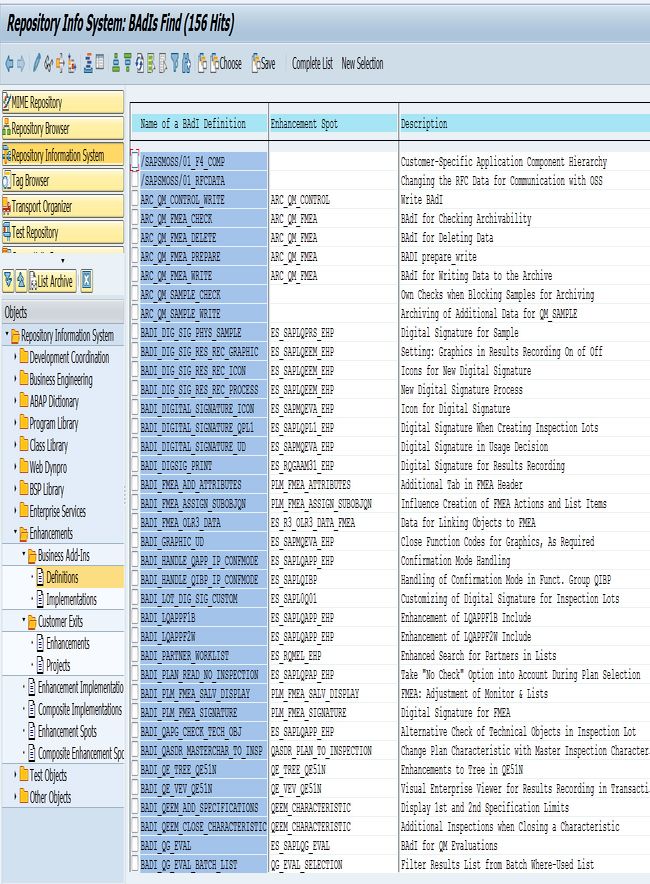
- Now please double click on menu "Repository Information System" > "Enhancements" > "Business Add-Ins" > "Definition".
- Now in the field "Application Component" you need to enter "QM*". Please enter a large number in field "Maximum No. of Hits", eg. 2000.
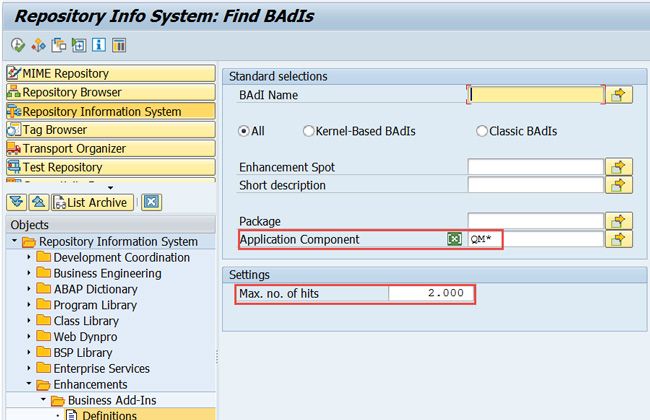
- Now execute (F8).
- Now you will see that the list of QM BADIs is displayed.
- Double click on any one of them and you will see the definition of the BADI and documentation. Or you can go to the t-code SE18 to check BADI details.
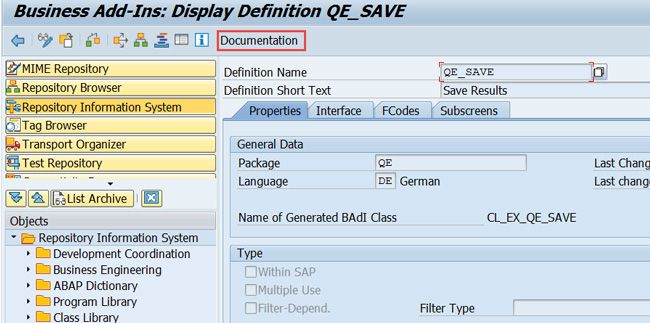
Here is the list of often used BADI's
INSPECTIONLOT_UPDATE Create and change inspection lot and usage decision
QE_SAVE Save Results
QE_RESULT_VALUATION Valuation of Single Values
NOTIF_EVENT_POST Notification Update: Retrieval of Notification Data
NOTIF_EVENT_SAVE Change When Saving Notification
How to find QM user exits?
Option A.
- First, run t-code SE80.
- Then on the left panel select 'Repository Information System'.
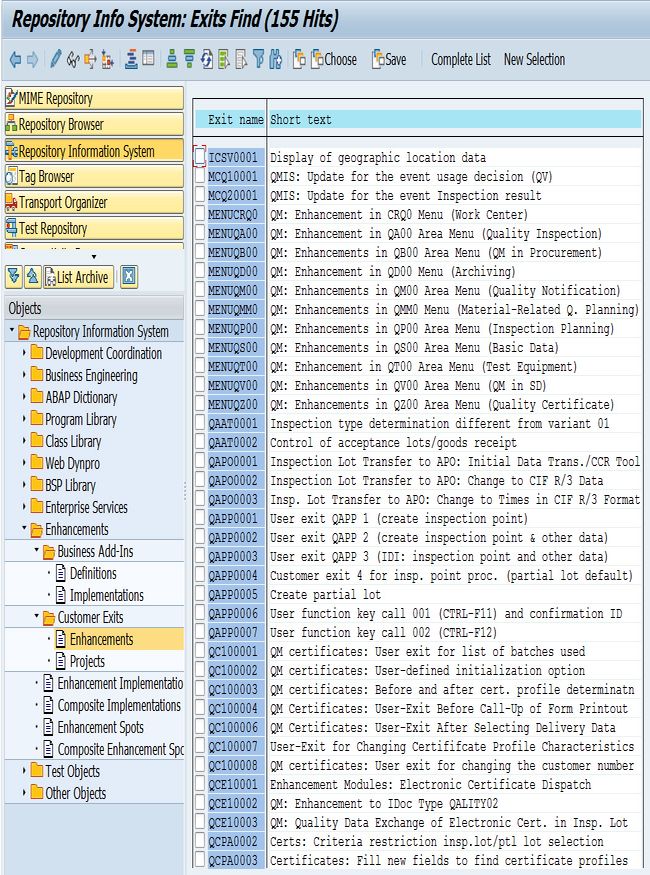
- Now please double click on menu "Repository Information System" > "Enhancements" > "Customer exits" > "Enhancements"..
- Now in the field "Application Component" you need to enter "QM*". Please enter a large number in field "Maximum No. of Hits", eg. 2000.
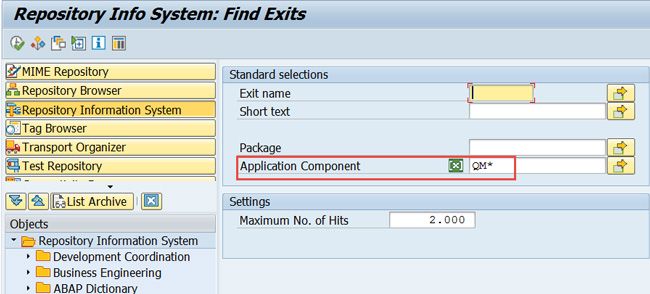
- Now execute (F8).
- Now you will see that the list of QM user exit is displayed.
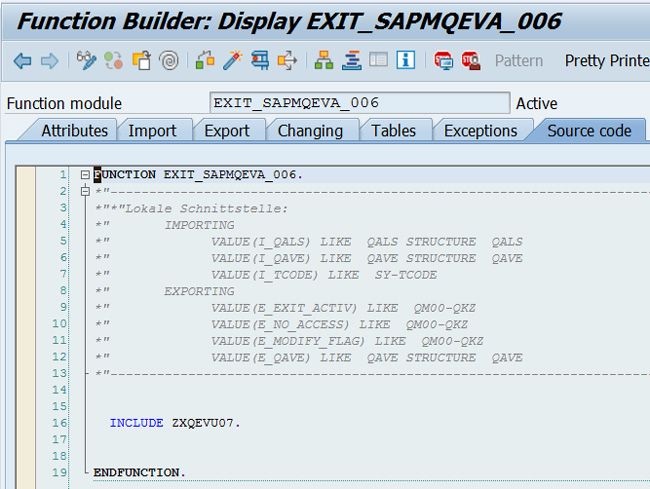
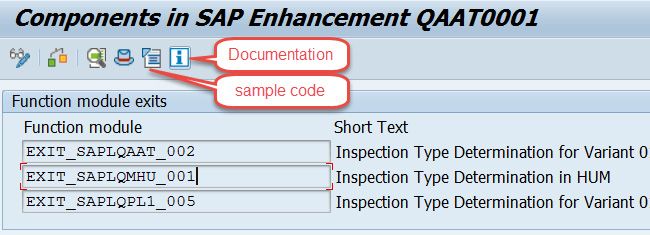
- Double click on any one of them and you will see the components in the SAP Enhancement. Sample code and documentation can also be checked by clicking respective buttons.
Option B.
- First, run t-code SMOD.
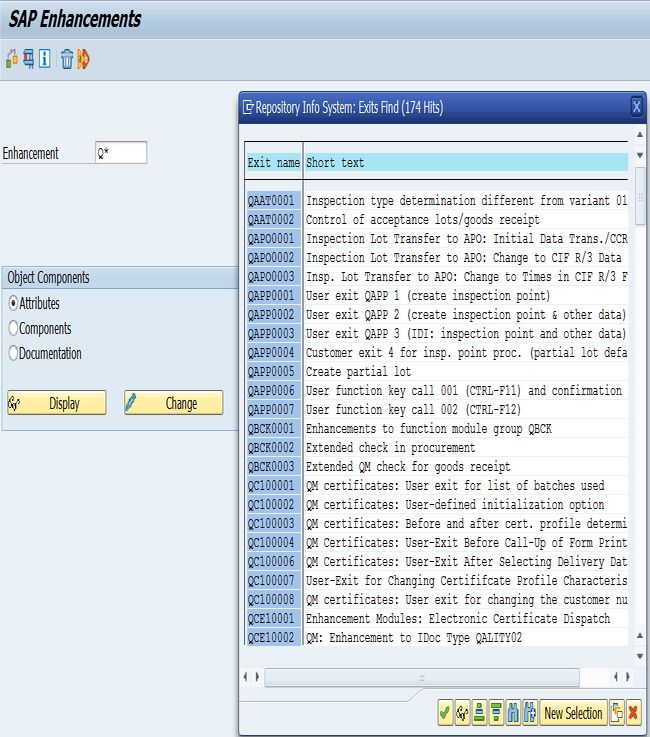
- Now please enter "Q*" in field "Enhancement".
- Now click F4 help.
- You will see a list of QM user exits.
- Please select any one of them and click the radio button "Attributes" or "Components" or "Documentation". Click button "Display" in order to check the details.
Option C. (If in case if the user wants to find what user exits are called for a specific t-code.)
- First enter the t-code, for example QA11.
- Now please set debugging mode by entering command "/h" in the command line.
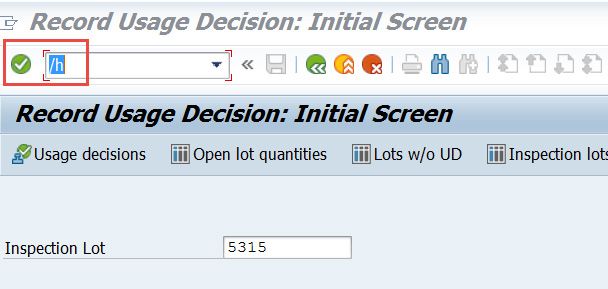
- And then press Enter.
- The debugger will open.
- Now please set a breakpoint at the statement "call customer-function".
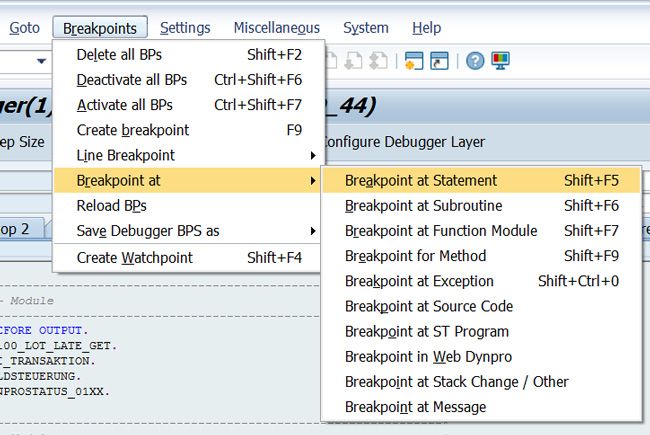
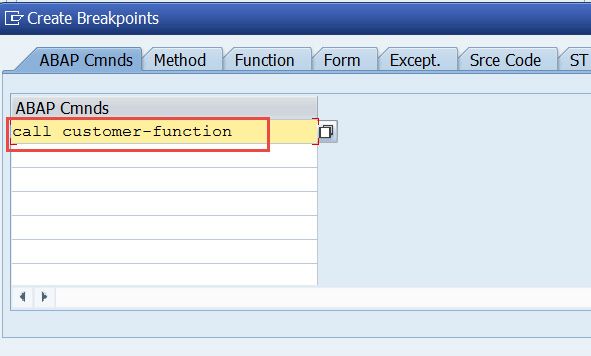
- Now Execute (F8).
- You will notice that the debugger will stop at every user exit.
- Now please click the program button. A new window will be opened to display the source code.
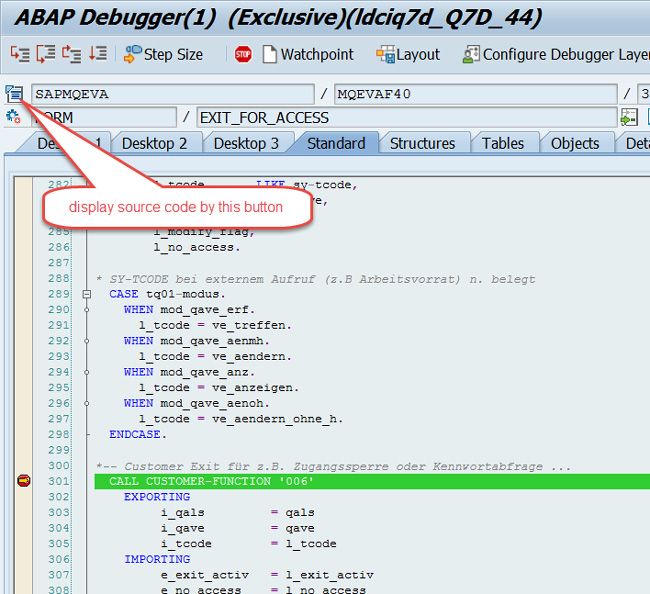
- Double click the user exit number.
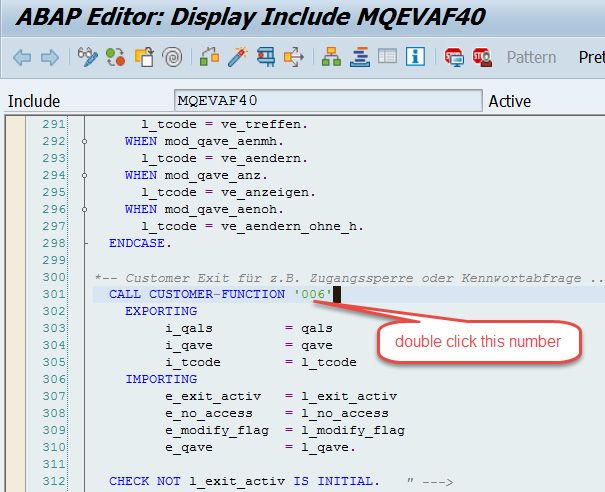
- The user exit definition will be displayed.
