Python is known for its general-purpose programming. But recently, it got popular due to data science and machine learning libraries. Among all its popular data science libraries, Pandas is one of the most prominent libraries. In this article, you will learn about Pandas and its different methods. Also, we will discuss the various operations data science professionals can do using Pandas.
What is Pandas?
Pandas is a robust, popular, open-source Python package that is loaded with data science and data analysis methods and functions. It also helps in performing machine learning tasks. Wes McKinney developed this library on top of another package named NumPy (Numeric Python), which renders support for multi-dimensional arrays, in Python (called the NumPy arrays or ndarrays).
Pandas allow data analysts and data science professionals to perform data wrangling, data cleansing, normalization, statistical analysis, etc.
The functions of Pandas are to:
- Analyze
- Clean
- Exploring
- Manipulate data
Pandas work well with numerous other data science libraries like Matplotlib, Seaborn, etc., inside the Python ecosystem. It also caters to a wide range of data structures and operations that helps in manipulating numerical data & time series.
This library is efficient and fast as well as provides high performance and productivity for users. To use Pandas, we can install the package and work on our IDLE or else we have to use the Jupyter notebook.
Then we have to use the import statement to use it within a program:
import pandas as pd
Advantages of Pandas:
- Pandas library is fast and efficient to manipulate and analyze complex data.
- It enables size mutability; programmers can easily insert and delete columns from DataFrame and higher dimensional objects
- It has good backing and the support of community members and developers.
- Pandas allow loading different data from different file objects.
- It also provides flexibility in reshaping and pivoting data sets
- It also provides an efficient way of handling missing data (also known as NaN - not a number) especially in floating-point and non-floating point datasets
- Data analysts can also merge and join data sets easily.
- It provides time-series functionality.
- It renders robust group by functionality to serve split, apply, combine operations on different datasets.
Features and advantages of using Pandas:
Below are some of the features and advantages of Pandas:
- Pandas easily handle the missing data.
- In data frames and higher dimensional objects, operations like insertion and deletion get performed easily.
- automatically aligns the data, such as objects getting aligned to a set of tables.
- Pandas enable fast and efficient analysis and manipulation of data.
- Allows reshaping and redirecting data flexibly.
Data Structures in Pandas:
There are two different types of data structures available in Pandas.
Series:
A series is a single column of linear data structure where every value within a series has a label. These labels collectively form the index of the Series. Let us take an example:
0 12
1 34
2 36
3 53
4 44
Here you can see five values and the indexing starts from 0 to 4. The column containing numbers to the right are the Series values.
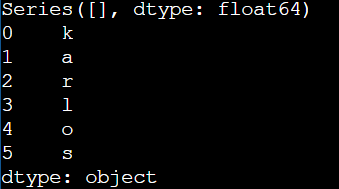
Program:
import pandas as pd
import numpy as np
# an empty series
s1 = pd.Series()
print(s1)
# numpy array that will help make a Series
d = np.array(['k', 'a', 'r', 'l', 'o', 's'])
s = pd.Series(d)
print(s)
Output:

DataFrames:
While series are beneficial in representing a one-dimensional column-like set of values, the majority of the data analysis work is performed through the DataFrames. DataFrames are planer data represented in tabular form with rows and columns both.
They store data in the table format having intersections of rows and columns, similar to that of spreadsheets or database tables. Most of the structured data in data science remain in tabular format.
Programmers can consider a DataFrames as a collection of series lying one after another—just like a combination of columns. Multiple series can be used to form a DataFrame. Here DataFrames contains a set of index values (represented by numbers – for rows) and column values (represented by names or attributes – for columns).
Example of DataFrame:
| web_site_visits | noOf_messages | noOf_comments | searches | |
|---|---|---|---|---|
| 0 | 345 | 435 | 365 | 102 |
| 1 | 231 | 701 | 679 | 176 |
| 2 | 980 | 32 | 211 | 03 |
| 3 | 100 | 99 | 37 | 24 |
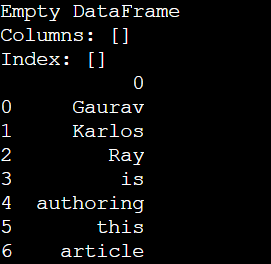
Program:
import pandas as pd
# using the DataFrame constructor to create empty DataFrame
dfr = pd.DataFrame()
print(dfr)
# list of strings that we will use to make a DataFrame
li1 = ['Gaurav', 'Karlos', 'Ray', 'is',
            'authoring', 'this', 'article']
# Using DataFrame constructor by passing the string list as parameter
dfr2 = pd.DataFrame(li1)
print(dfr)
Output:

Conclusion:
Hope this article has given you a crisp idea of what Pandas is and its different data structures. Also this article caters to some useful features and benefits Pandas provide. Pandas are mostly used by data science professionals and statistical professionals to handle large data in tabular format.