How to use ST12 for trace analysis?
ST12 (Single Transaction Analysis) was initially developed to promote the usage of ABAP trace, for integrating ABAP and performance traces (SQL Enqueue RFC, transaction ST05) and for making the entire process of tracing analyzing process faster and much more convenient.
The main focal entry point for performance analysis is the ABAP trace with ST12. This should ideally be used to detect any top-down issues related to performance hotspots, for functional time distribution analysis, and for optimizing ABAP/CPU-bound issues. SQL trace should typically be utilized for DB-bound issues.
Prerequisites for Using ST12
- Proper user authentication, such as developer roles or SAP Basis access.
- Activation and appropriate setup of system tracing.
- Sufficient memory and disk space to store trace files.
- Ability to identify and track relevant transactions or jobs.
- Awareness of potential impacts on system performance during tracing.
- Compatibility of the SAP system version with ST12 and its availability.
- Basic knowledge of processes, SQL, and ABAP programs.
The ST12 trace analysis will follow the below-mentioned steps:
- Selection of Trace Parameters
- Start and Collect Trace
- Analyzing the Collected Trace
1) Selection of Trace Parameters:
The Trace parameters can be categorized as below:
- Trace For
- Type of Trace
Trace For:
The User/Tasks permits a developer to select a User for whom the trace is to be captured along with a task for which the trace has to be captured. The task can generally vary from Dialog, batch, etc. Selecting * in Tasks shows all the tasks that are captured.

The Work process permits the user to select the server for which the trace should be captured. Generally, all the servers will be captured even when not specified.

The Current Mode option is utilized for tracing the flow of a Transaction or a Program.

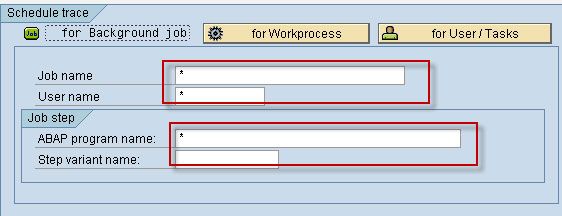
The Schedule option is mainly used for running the trace for a batch job for a varied selection criterion such as a user name, Job name, and Program related to the Job.
Type of Trace:
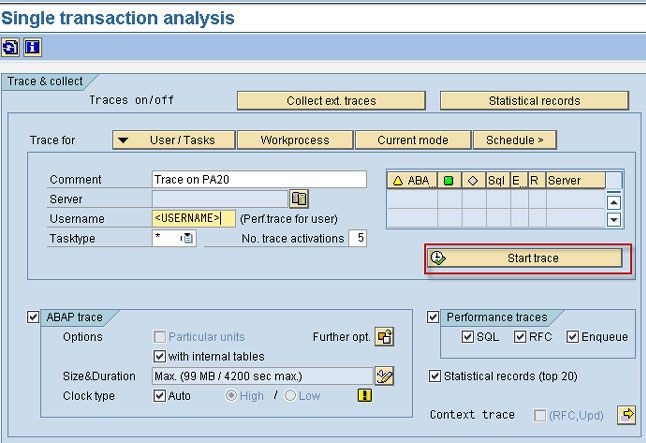
ST12 trace can either be started as an ABAP Trace or Performance trace or both. If the trace extends to a long duration, then by setting the Size & Duration Parameter to MAX as highlighted ensures that the entire trace is successfully captured.

2) Start and Collect of Trace
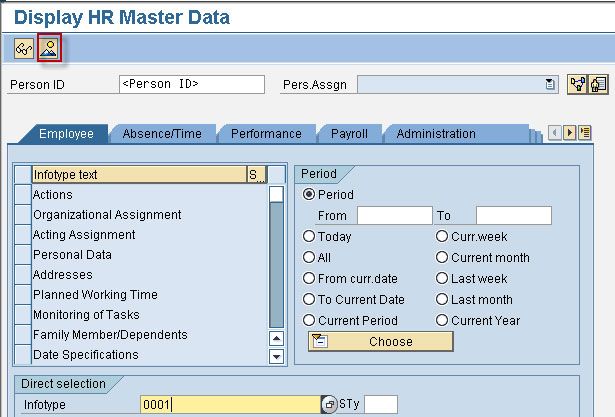
Assume that the trace has to be captured for the flow associated with checking a user's Info type 0001 data through PA20.
First, set the required Trace parameters. Then, select the User/Task option by providing the Comment, User Name, and Task type as *.
Next, select Start Trace.
Now user needs to open the transaction PA20 and regenerate the performance issue
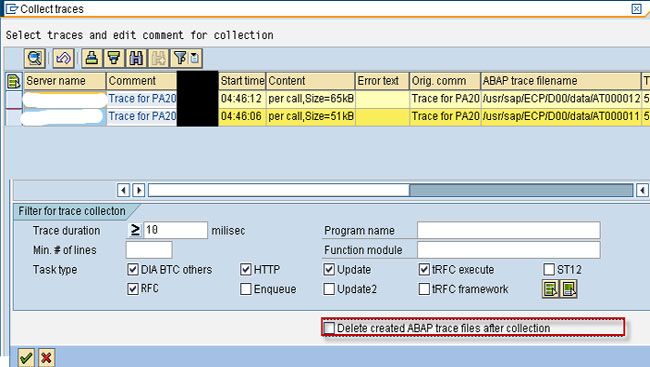
Now, upon selecting the End Trace in the ST12 trace screen, the user will be taken to the collect trace screen. The user should click the execute button to collect the trace details.
Note: Ensure that the highlighted checkbox is unchecked if the trace needs to be used for future analysis.
3) Analyzing the Collected Trace
The trace is ready for analysis once it is collected. In the highlighted bottom pane, the user selects the relevant trace.
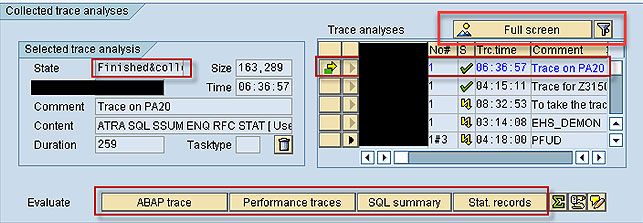
User selects one of the above 4 highlighted options for the analysis. The overview of all the traced collected can be seen in the 'Full screen' button.
Traces for Batch Processing
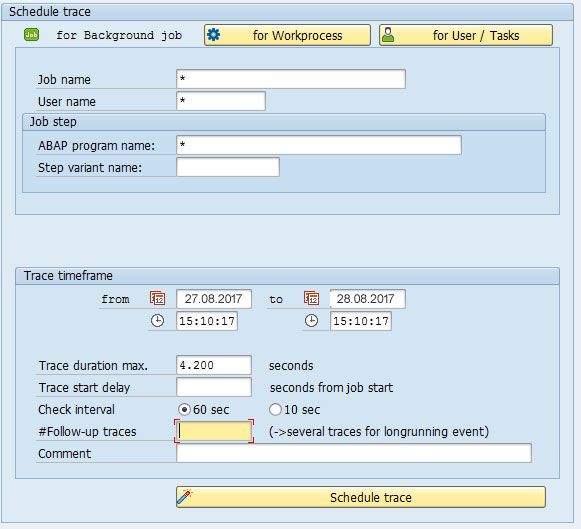
- It is to be noted that the maximum duration for an ST12 trace will be 4200 seconds and a file size of 99MB (default size is 20MB which is recommended).
- Manually triggering a trace at the beginning, middle, and end of a long-running job is suggested for long-running jobs, if possible. The delay option allows the user to trace the job by starting at a point in the program.
- Additionally, there is a feature that permits follow-up traces where consecutive traces can be taken (for example 2 traces @ 4200 seconds per trace).
- The user can also schedule a single trace by using the Job name, User, and ABAP program for tracing the accurate issue.
ABAP Trace
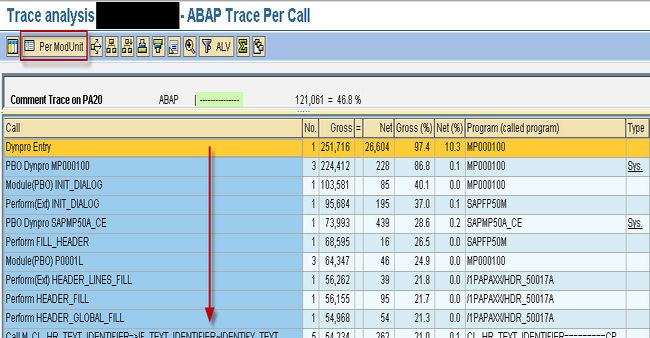
In ST12, the ABAP trace is known to be one of the most useful analysis options. ABAP trace provides a Top-Down flow of any Hotspot/Program/Transaction along with providing a Functional Time Distribution of a flow.
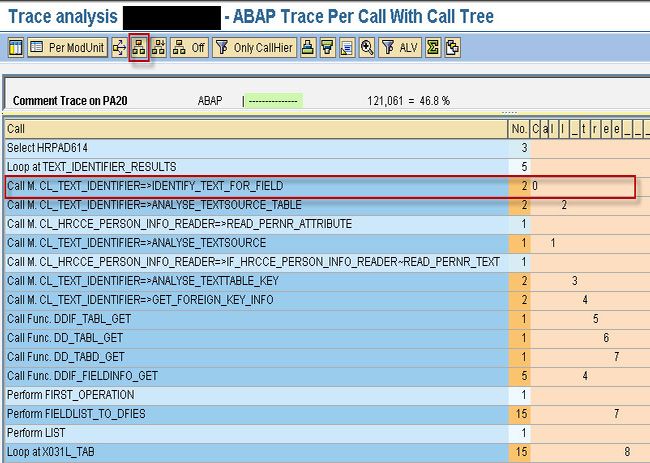
ABAP trace also displays the hierarchical order in which the call statements are executed. Therefore, it can be used for identifying the issues in the flow hierarchy.
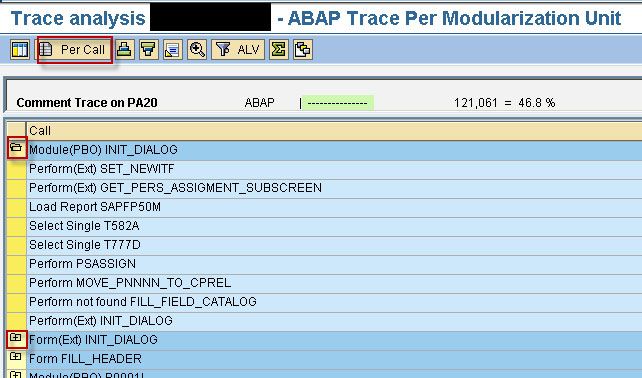
In the above screenshot, one can see the Per Call View of the ST12 trace. The view can be modified into a modularized one by selecting the Per Mod Unit button as highlighted above.
This will give a modularized flow of the Code that is present inside a particular module.
The “Top Down Call Tree” option when clicked on the cursor placed on a Modularization Unit Call(Method/Performs) exhibits all the calls to the selected unit which are labeled as ‘0’,’1′ are statements inside this modularization units, ‘2’ the statements in modularization units one level below, and then iteratively down up to 30 levels. Letters are utilized for designating the lower levels.
The user can navigate to the source code by double-clicking on any line, which can also be used to identify the impact point.
The ST12 trace allows the user to capture minute details of the flow, such as the performance of loop statements and can be used for a detailed analysis of the flow.
ABAP trace is a very effective tool and can be used for identifying customer modifications or user exits, as the ABAP trace captures the complete flow.
Note: The call hierarchy contemplates the call on Methods, PAI Modules, Loops functions, Forms, SQL statements, and Call Screen to PBO.
Performance Trace
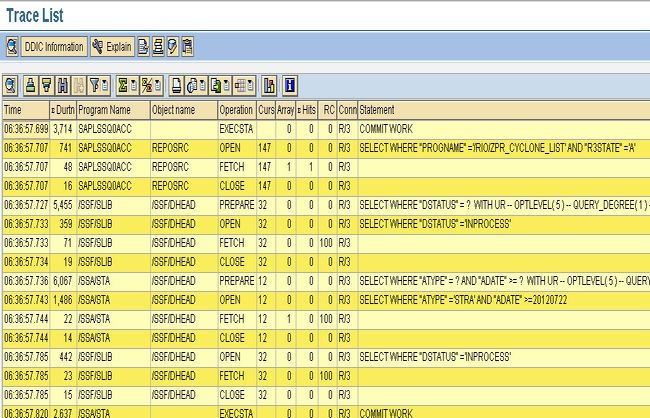
The performance trace of ST12 is equal to the ST05 trace. The performance parameters of all the database statements executed in the flow are displayed here.
SQL Summary
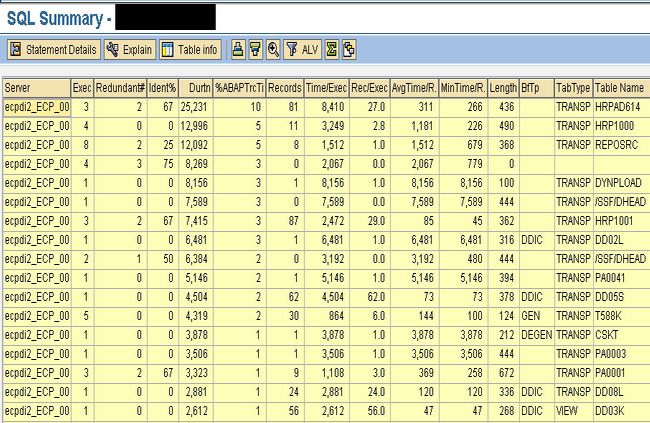
SQL summary lists down details such as No. of records selected, server details, Execution time, Total duration, etc. on a query on a database table.
Double-clicking on any record takes the user to the flow to a screen that displays the list of programs that have been queried on the table and the SELECT query as such.
Statistical Records
The time-related parameter of a particular transaction flow is displayed in the statistical records.
Conclusion
ST12 simplifies trace analysis in SAP by integrating ABAP and performance traces, making it easier to identify and resolve performance issues. It allows users to identify performance bottlenecks, analyze transaction workflows, and optimize system operations efficiently.
You can successfully handle both ABAP and database-bound problems by adhering to the described procedures and making use of sophisticated features like batch processing and follow-up traces. Gaining proficiency with ST12 guarantees enhanced SAP system efficiency and a more seamless debugging process.
